Activity, not just presence
A desk in use for focused work is not the same as a desk someone dropped a bag on. Occupancy classifies what the space was being used for.
Space utilisation measurement
Most occupancy figures answer the wrong question. They tell you a desk was occupied, not what happened there, for how long, or whether the space was doing its job. Occupancy measures the difference, through observation, sensors or wifi, whichever fits the building and the budget.
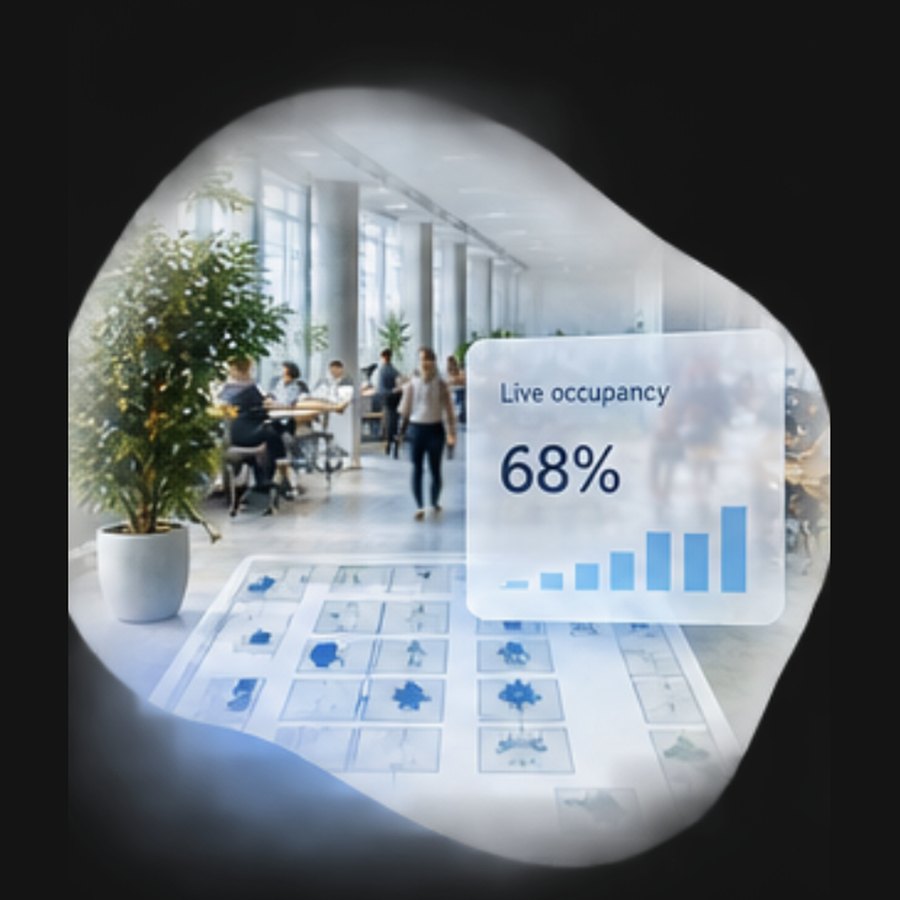
When you propose giving up a floor, the first question is how you know. This is the answer, with the method attached.
Because your own people can run the study, measuring twelve buildings costs less than twelve times measuring one.
Repeat next year on the same method and you have a trend instead of two disconnected snapshots.
Occupancy shows what happens in the space, not why people stay away. That is a different measurement and it is what Dynamics is for.
Accuracy, speed, cost and privacy exposure pull against each other. Which method fits depends on the building and the decision, not on a preference, and the wrong choice is usually discovered at the point the number is questioned.
| Observation study | IoT sensors | Wifi triangulation | |
|---|---|---|---|
| What it measures | Presence and activity, a trained observer records what the space was being used for. | Presence and duration per space, continuously. Blind to activity unless combined with something else. | Device counts per zone, derived from existing access points. |
| Accuracy | Highest on activity, which is the measurement that changes a space requirement most. Sampled rather than continuous. | High on presence and duration. A bag on a chair reads as occupied. | Coarse per space, dependable at floor and building level. |
| Lead time | Two to four weeks of measurement across a representative range of days, plus analysis. | Installation, then a few weeks of baseline. Continuous from there. | Days, where your access-point vendor's location analytics are already licensed and calibrated. Weeks if the zones still have to be mapped. |
| Cost driver | Observer hours. Substantially lower when your own people walk the rounds with our methodology behind them. | Hardware, installation and a subscription per sensor. Scales with the number of spaces. | Lowest marginal cost where the wireless network already covers the building. |
| When you choose it | A one-off decision that has to survive a board: a lease event, a programme of requirements, a consolidation case. | You need a signal that keeps, a trend across years, or you manage space operationally. | Portfolio-wide sizing at floor level, or a fast first read before committing to a fuller study. |
| GDPR consequence | Lowest exposure. No personal data, no identification, aggregated counts per space. | Low under the GDPR: presence and movement, not identity, provided the sensor type captures no images. Note that works council rights attach to any system capable of behavioural monitoring regardless of that, so sensors are a works council conversation too. | Highest exposure. Device identifiers are treated as personal data, which normally means a DPIA and works council consent. |
| Its blind spot | It is a sample. It cannot tell you about the week it did not cover. | It counts occupancy, not use. Pair it with Dynamics or an observation round to learn why. | Modern phones rotate their MAC address per network, which undermines de-duplication and therefore the count itself. It also cannot distinguish a meeting room from the corridor outside it. |
Methods combine, and usually should: an observation study to classify activity, sensors to keep the signal running afterwards.
There is no licence price for a measurement round, because there is no standard round. Cost follows three things: the method, the number of buildings and floors, and who walks the observation rounds.
A single building on a lease deadline and a twelve-building portfolio baseline are different orders of magnitude, and we would rather scope yours than publish an average with no method behind it. Send a floorplan and a date and you get a number, not a brochure.
A desk in use for focused work is not the same as a desk someone dropped a bag on. Occupancy classifies what the space was being used for.
Utilisation mapped onto your own floorplans, so an underused wing is visible as a place rather than as a row in a table.
Your team can carry out the observation rounds using the app, while the methodology, processing and analysis stay with us.
Short experience questions during the study, so you learn why a space is avoided and not only that it is.
Output built for a board paper: what was measured, how, over what period, and what follows from it.
The measurement is carried out by a certified partner in your region, or by your own team, with our methodology, software and analysis behind it. The advisory work, the space programme and the fit-out belong to the partner — that boundary is deliberate and we keep it explicit.
Occupancy measures how offices are actually used, through observation studies, IoT sensors or Wi-Fi triangulation. It classifies the activity rather than only recording presence, maps utilisation onto your own floorplans, and reports on one method so this year and next year can be compared.
The method was commissioned in 1998 by the Dutch Ministry of Economic Affairs and has been tested against real buildings ever since.
In a managed study we design and coordinate it end to end: floor plan preparation, the measurement rounds, quality control, analysis and reporting.
In a self-managed study your own team runs the rounds using our process and tooling. It costs less and it scales: measuring twelve buildings is not twelve times the cost of measuring one. Which fits depends on internal capacity and how often you intend to repeat it.
They answer different questions. Sensors give continuous, space-level readings where they are installed. Wi-Fi analytics derive utilisation from aggregated network activity and give building-, floor- and zone-level patterns without installing anything.
Wi-Fi is aggregated by design. It is not a way to see what an individual did, and we will not present it as one.
No. Occupancy says whether a space was in use at a moment. It cannot say whether the work went well.
A desk with a bag on it is occupied and supports nothing. That gap is exactly why activity classification exists, and why the occupancy figure travels with workforce evidence rather than alone.
Start from the decision. A lease decision on one building is a short observation study. Ongoing monitoring of a portfolio is sensors or Wi-Fi. A brief for a fit-out needs activity classification, which observation does best.
Budget, existing infrastructure and what your works council will accept usually narrow it further.
A measurement round is quoted per study, because it is scoped per building, period and method — there is no standard round and we would rather scope yours than publish an average. Tell us the building and you get a number, not a brochure.