Aggregated by design
Results are reported at team, department and location level. Individuals stay anonymous. That is how the method is built, not a setting you switch on.
Workplace experience research
Occupancy shows what happened in the space. Dynamics shows what people needed from it: working patterns, preferences, and how much the workplace helps or hinders the work. Reported by team and location. Never by individual.
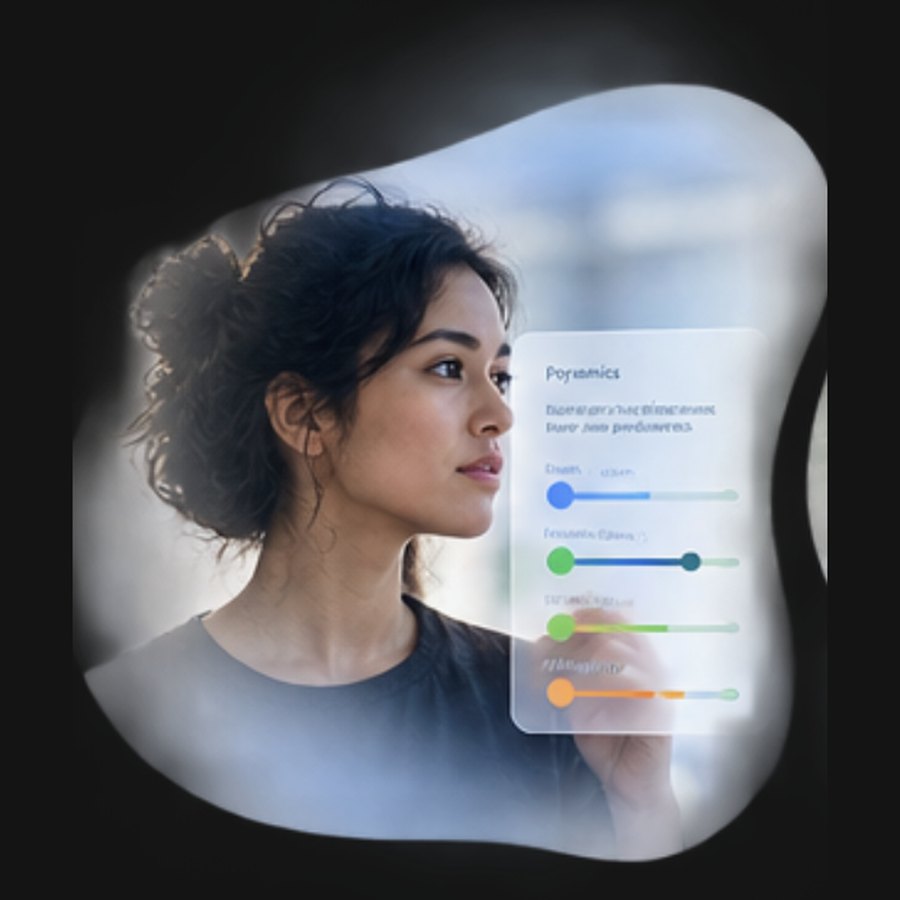
When a floor sits empty, Dynamics tells you whether it is the desks, the noise, the commute or the policy.
One dataset that speaks to retention and to square metres, usually where these conversations stall.
You asked, and the plan visibly follows from what they said. That is most of the change management.
Use case
A 500-employee firm with 18% turnover, a 65% response rate and a retention score of 62%. Five pillars showed where the workplace, not the pay, was driving people out.
Results are reported at team, department and location level. Individuals stay anonymous. That is how the method is built, not a setting you switch on.
How much the workplace helps or hinders the work, as a score you can compare across teams and locations rather than debate.
Built on the Competing Values Framework, so you can see where the workplace supports the culture you have and where it fights it.
Preference and working style measured with the Big Five via TIPI, rather than a satisfaction survey with a smiley scale. Reported as patterns, never as a person.
Travel time, distance and CO₂ per employee, which turns a policy discussion into a number you can report.
Your results set against a dataset built since 2001, so a score means something beyond your own building.
Dynamics aggregates for the organisation. Entry Pass gives each person their own answer, which space suits which task, and what conditions they actually work well in.
That exchange is what makes aggregation a fair deal rather than a policy. It is also why people take part a second time.
Dynamics is workplace assessment. It establishes how people work: where, when, with whom, on what, what helps them and what gets in the way, measured across activities rather than as one satisfaction score.
It is the product that tells you why a floor is empty, rather than only that it is.
It depends on the product. Dynamics asks them to answer questions once. Occupancy does not involve them, though they should be told it is happening. Entry Pass gives them something back.
Participation should be worth their time, and they should know what is collected, what it is used for and what returns to them.
Entry Pass is for the individual. There is no manager view of it.
Where a product does report to the organisation, it reports aggregated patterns. If you are evaluating this as a works council, ask for the specific configuration in writing rather than relying on a website: that is what the DPA is for.
The analysis is not the deliverable, the decision is. Depending on scope: scenarios, a hybrid policy, a space programme, support through design and fit-out, employee enablement, and then measuring again on the same method.
That last step is what turns two snapshots into a trend and a trend into the next business case.
Dynamics sits in every plan, from $3.87 per completed employee per month — you pay for the people who took part, not for everyone who could log in. Bring one decision and we will tell you what it takes to measure it.